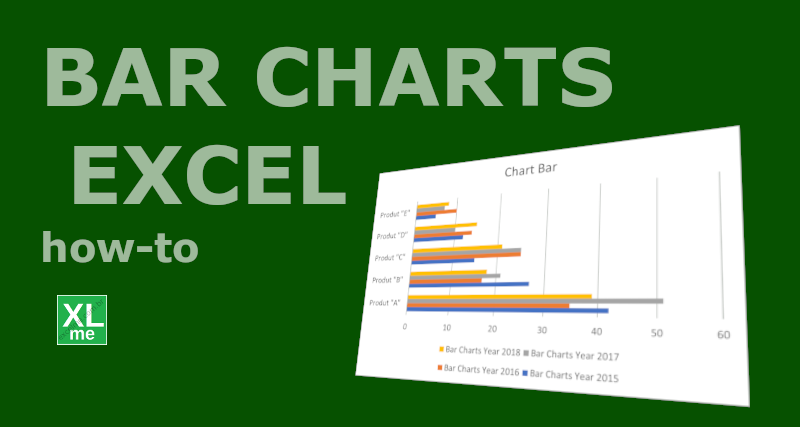
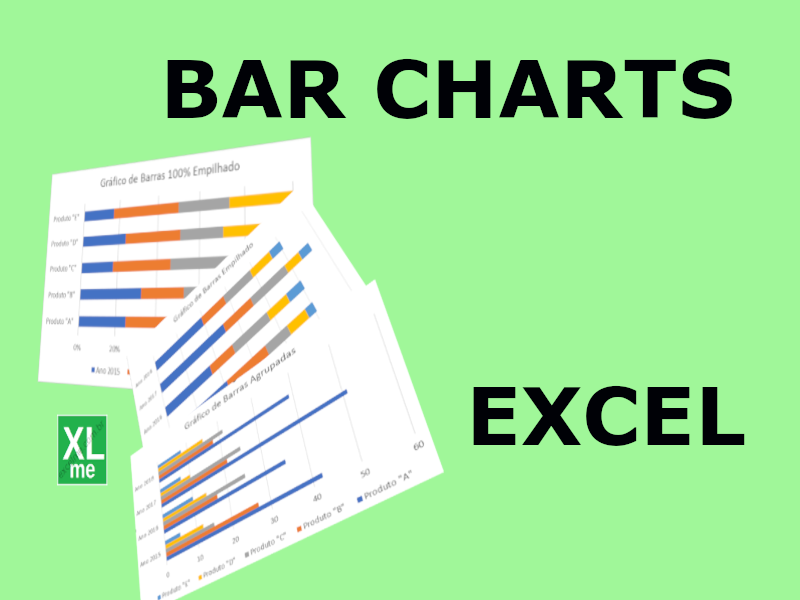
How to make a bar chart in Excel
Bar charts are often used in dashboards because it visually represents the data in spreadsheet in a format that makes complex data easier to understand. To plot the bar chart in Excel you must: Take a spreadsheet with data that can be separated into categories such as year, product and/or city. Select cells with data, …


